By Catherine Spisszak
Valentine’s Day…it’s a holiday that some Americans love and some love to hate.
In the spirit of the holiday, we thought it would be interesting to take a look at the newly released 2005-2009 American Community Survey (ACS) data to find out where in America people are more likely to be married or single.
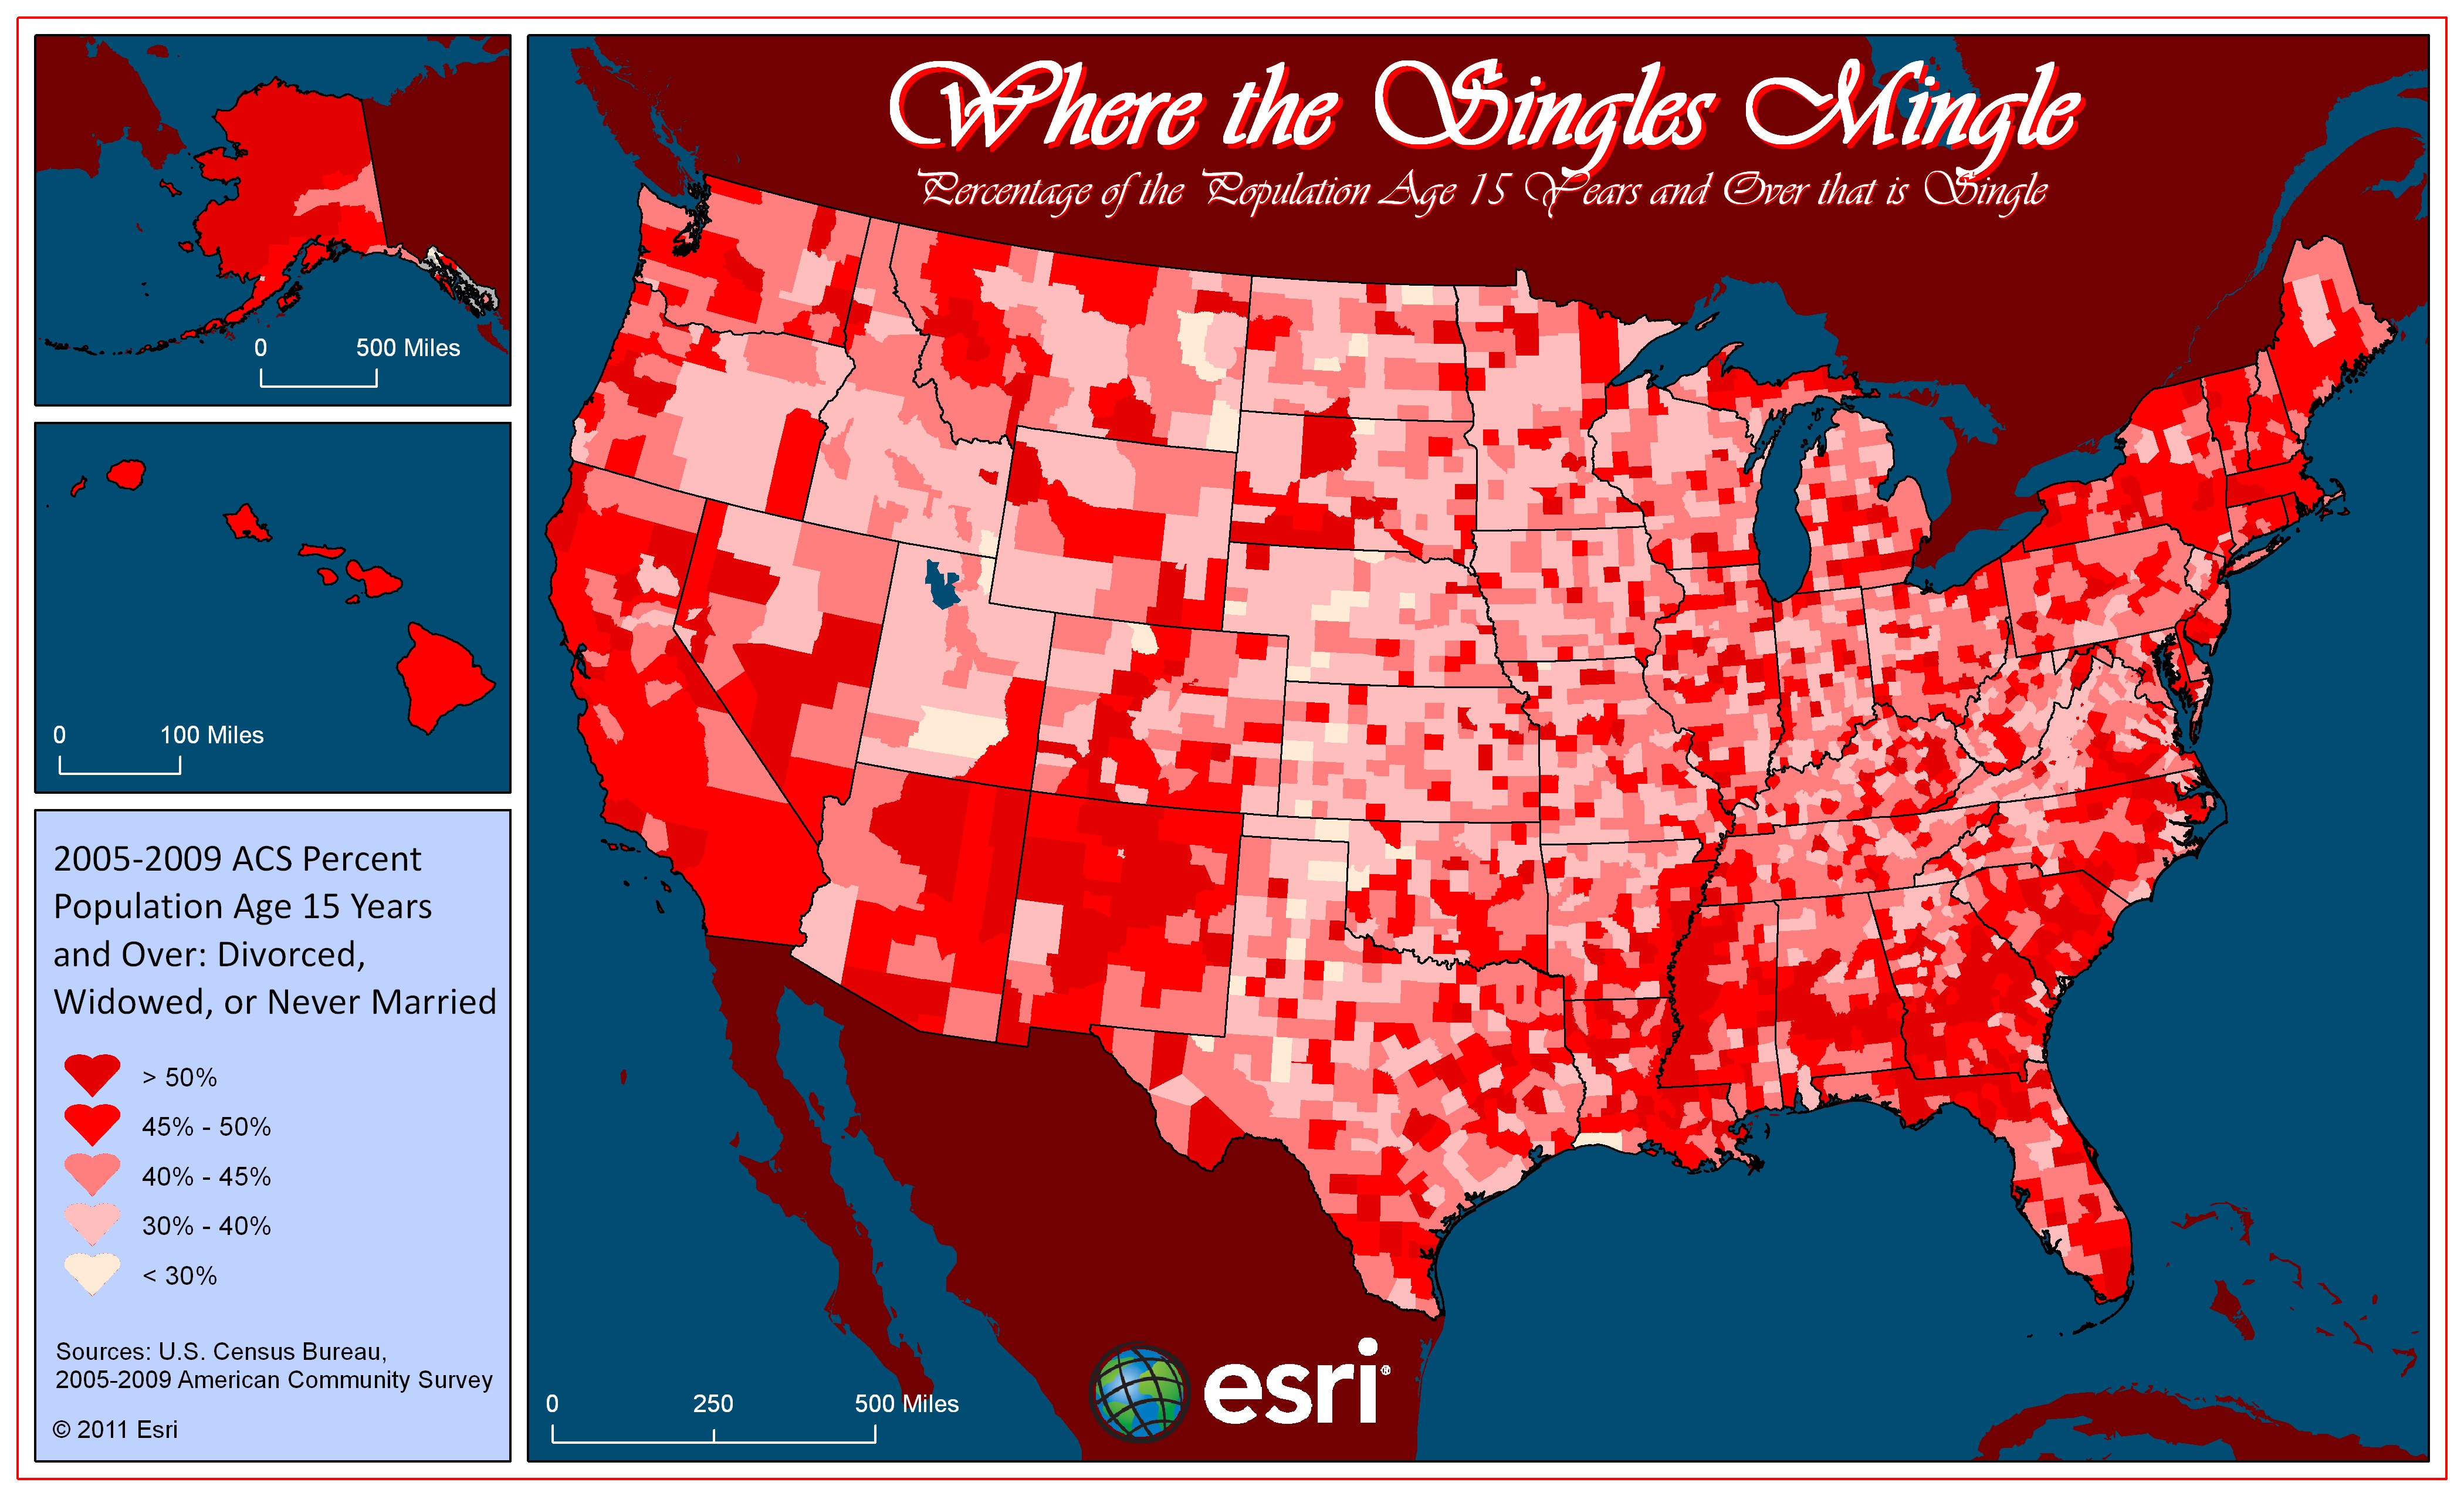
First, let’s take a look at a color-coded map of the percentage of the population age 15 years or older that is single – which includes those that are not married, are widowed, or are divorced. The county with the highest percentage of singles, according to the 2005-2009 ACS estimate is Kalawao County, Hawaii where 75.6% of the population age 15 years and older are classified as single. In Rosebud County, Montana, the percentage is much lower with 40.4% of the population classified as single.
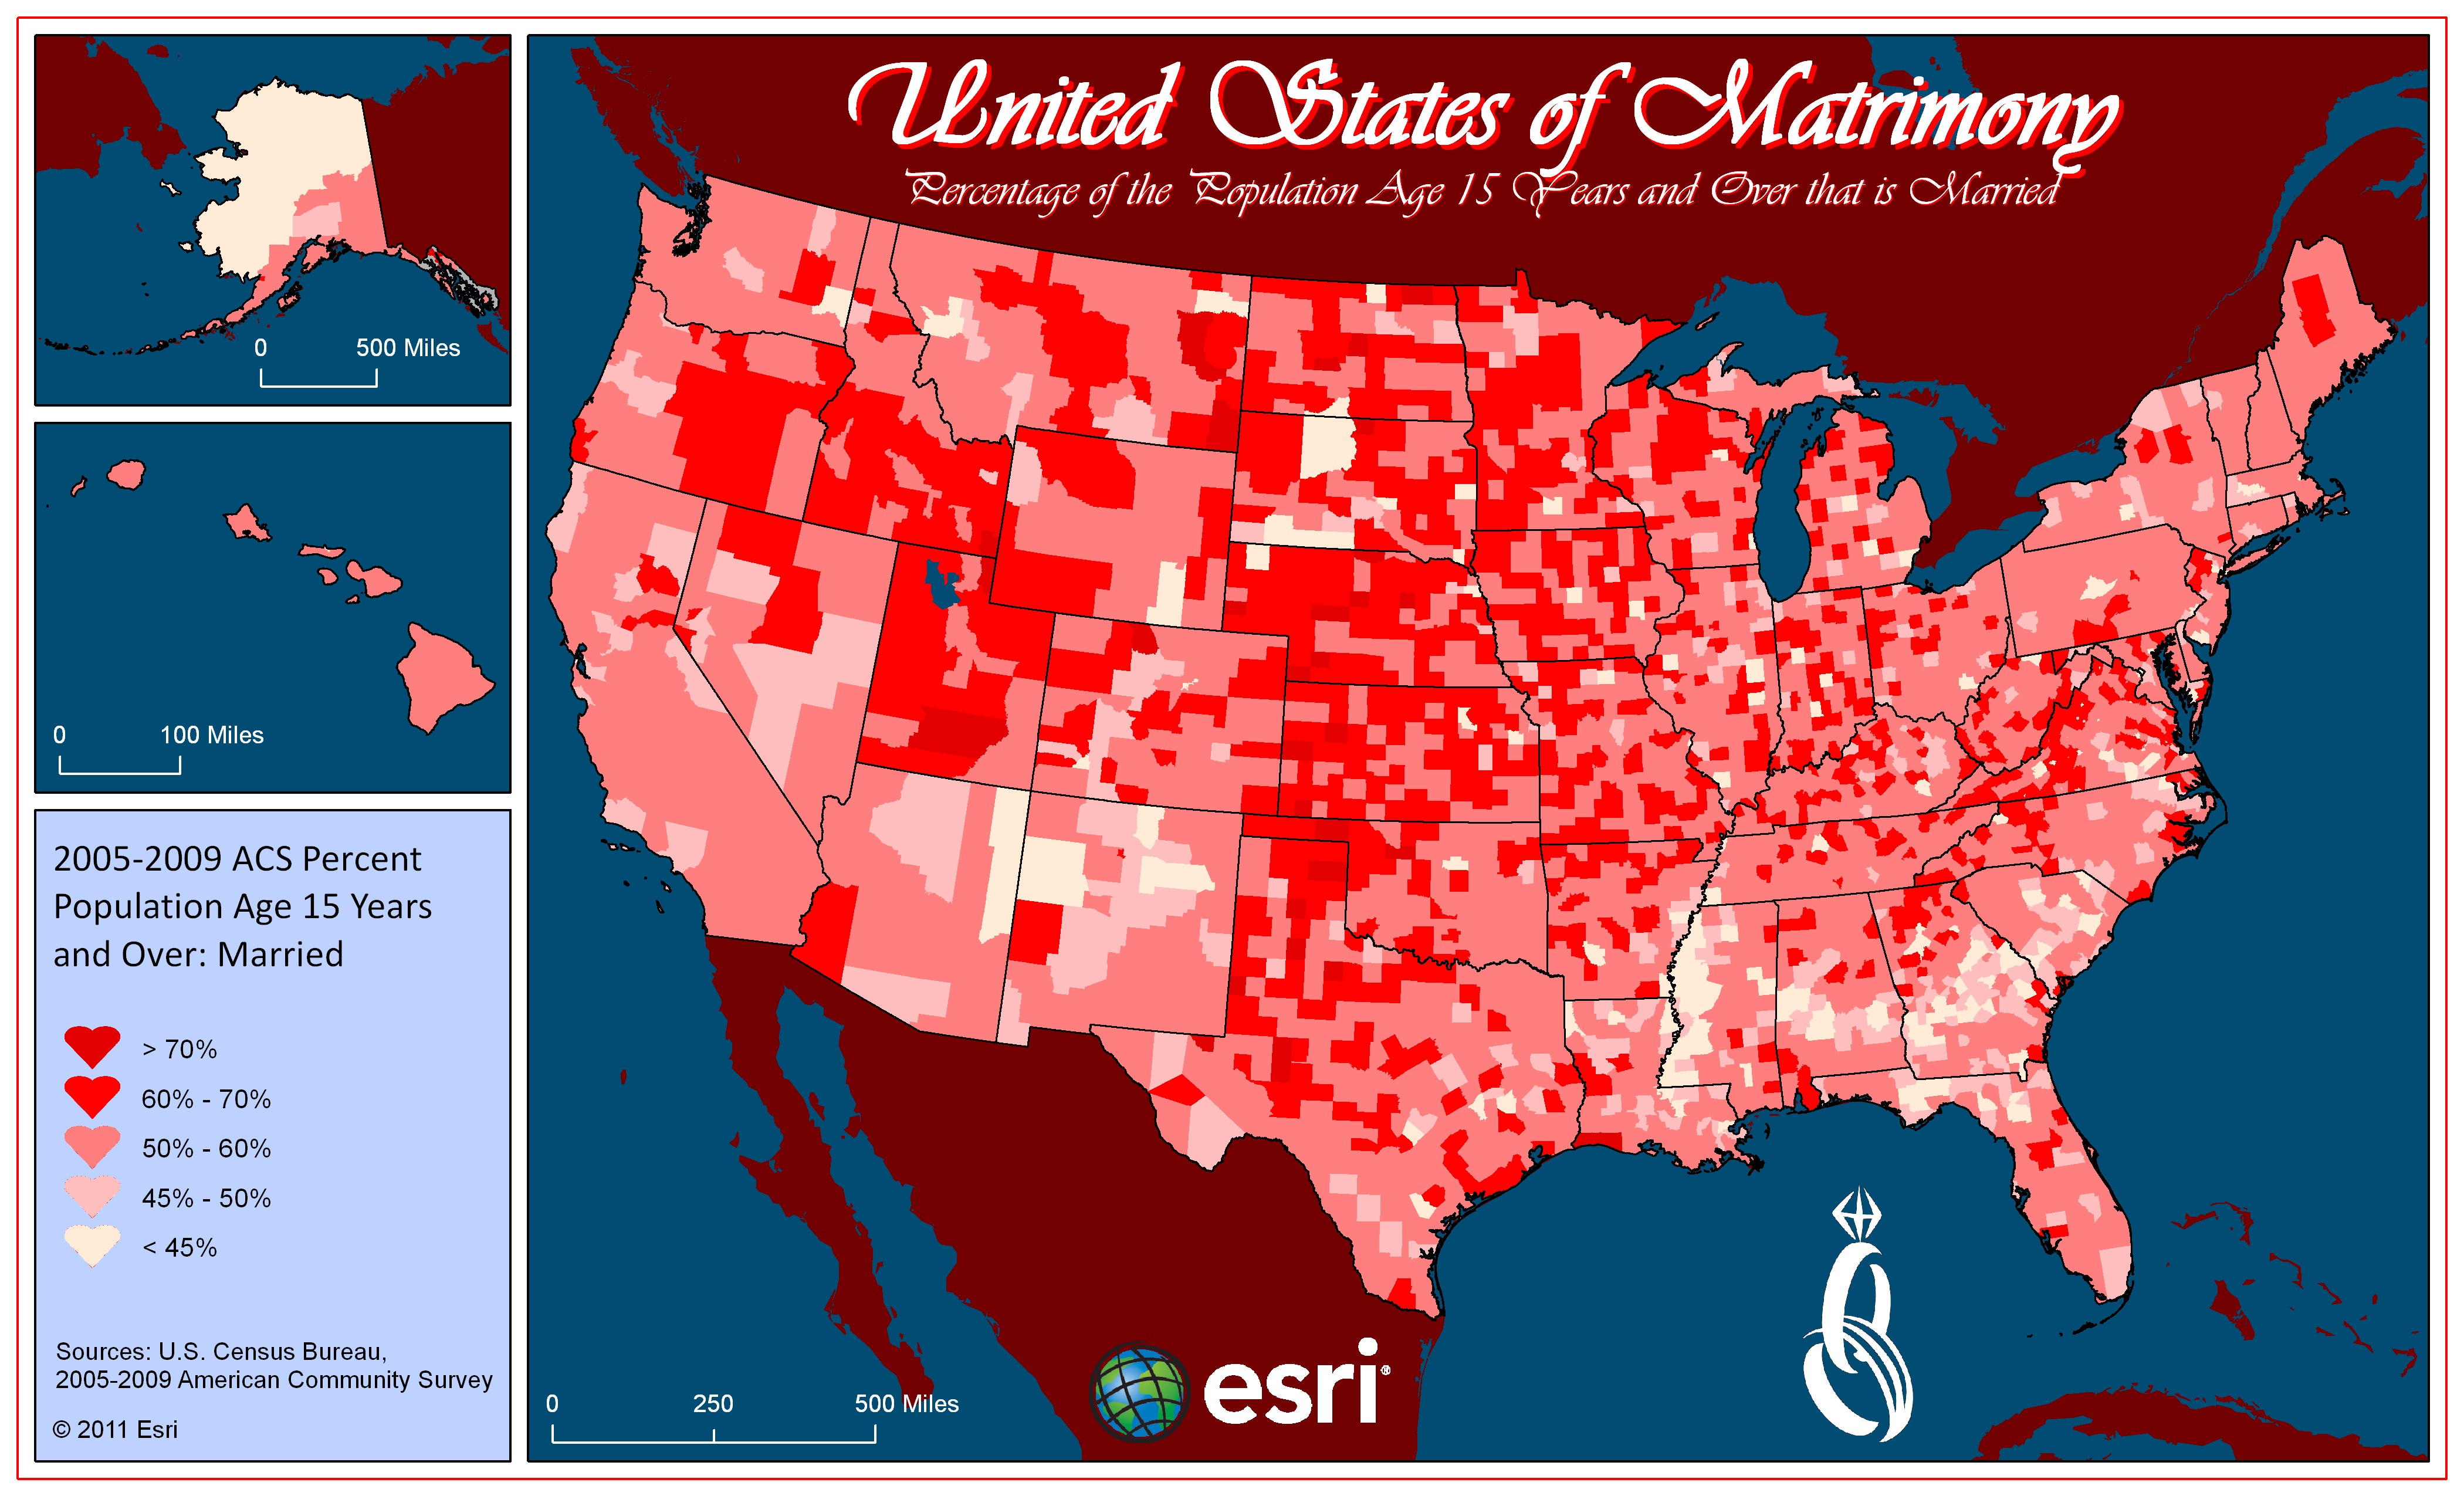
Here is a color-coded map of the 2005-2009 ACS data on the percentage of the population age 15 years or older that is married. Ironically, Loving County, Texas has one of the cutest county names in the U.S. and the highest percentage of population that is married, at a whopping 93.6%.
We can also use the 2005-2009 ACS data to compute a male to female ratio. Baker County, Georgia is a promising place for single men. There are 74.3 males for every 100 females there. Conversely, in Lassen County, California there are 187.8 males for every 100 females. In Love County, Oklahoma there are 95.1 males for every 100 females.
ACS Data, shown in the maps above, is released annually by the Census Bureau. It is based on a rolling survey and has replaced the long form of Census 2000. Now data about income, education, employment, language, migration, citizenship, marital status, and housing characteristics, such as value and rent, will be obtained from the ACS instead of the census sample. To use data from the ACS, it will be necessary to incorporate estimates of sampling error or margin of error (MOE) which is included with all ACS estimates.
For more information on ACS Data, please visit our Resource Center on Census 2010 and ACS Data where you can ask questions and provide feedback directly to our Data Development team. We also encourage you to read three ArcUser Online articles written by Lynn Wombold, Esri Chief Demographer, on the topic ACS. These articles are entitled:
- Changes and Challenges: Understanding American Community Survey Data
- Sample Size Matters: Caveats for users of ACS tabulations
- Examining Error: Consider the effect of sample size and error source when using Census data
Note: These maps do not include the Margin of Error (MOE) for each estimate.
Happy Valentine’s Day!